Research Retreat by Rahel Craft (Composer)
October 2nd – 26th, 2022, April 25th – June 4th, 2023 in Memu
Memu Open Week, June 6th – 10th, 2023 in Tokyo
ー
Echoes of Memu @ Open Week
Echoes of Memu combines soundscapes recorded around Memu between 2019 and 2023 by Nick Luscombe, James Greer, Eisuke Yanagisawa and Rahel Kraft. New sounds will be added during the Open Week, reflecting on the individual approaches of each artist and the idea of creating a collective ear. As they wandered around Memu, each person has taken different paths and chosen different perspectives. These listening points echoe the specific soundscape surrounding Memu, creating an ever-changing atmosphere throughout the week. The samples are combined and recombined to a score by Rahel Kraft, accompanied by her musical and atmospheric compositions.
Tuesday: soundscapes by Rahel Kraft
Wednesday: added soundscapes by James Greer
Thursday: added soundscapes by Nick Luscombe
Friday: added soundscapes by Eisuke Yanagisawa
「Echoes of Memu」は、2019年から2023年の間にメム周辺にて、ニック・ラスカム、ジェームズ・グリア、柳沢英輔、ラヘル・クラフトによって録音されたサウンドスケープから編成されます。オープン・ウィークをとおして、共働する耳(集合知という意味での、集合耳)という考えのもと、個々のアーティストそれぞれのアプローチを反映しつつ、新しい音が加えられて行きます。メムの周辺を探索するにあたり、各自が異なる場所を歩き、そして異なる風景を見てきました。これらの異なる場所の音は、このオープン・ウィーク中、メムを取り巻く特徴的なサウンド・スケープを呼び起こし、1週間をとおして刻々と変化する環境を作りだします。サンプリングされた音は、ラヘル・クラフトにより彼女の音楽的、また環境的作曲とともに楽譜に編成され、また再編成されました。
火曜日: ラヘル・クラフトによるサウンド・スケープ
水曜日: ジェームズ・グリアによるサウンド・スケープが編成されます
木曜日: ニック・ラスカムによるサウンド・スケープが編成されます
金曜日: 柳沢英輔によるサウンド・スケープが編成されます
“shallow subsurface – temperature”
text: Hande Unlu
The University of Tokyo, Institute of Industrial Science
published on April 26th, 2021
–
potential that lies in the underground temperature
Underground heat has always been a great potential of energy resource and habitat to varied activities for a long time in the world history¹. Therefore, reading the underground soil structure and looking for possible effectors like nearby aquifers and water well, which all might affect the underground temperature, was necessary to understand the nature lying underneath Memu.
reading the underground temperature for a year
Following the underground survey (#shallow subsurface – geology), we installed 8 temperature sensors inside the borehole at every 2.5m under the ground until -20 meters. Additionally, we installed a sensor at 1m high above the ground to read the outdoor temperature.
After temperature sensors started their operation, we also installed a water level sensor at 15m deep inside the hole.
In 2020, temperature and water level sensors provided us to monitor around-the-year natural phenomenon occurring underneath Memu.
what we found underneath Memu…
In 2020, all year-long hourly recorded temperatures showed us that at Memu, regardless of the above-ground being extremely cold or hot, the temperature is quite stable after 2.5m under the ground, unlike the outdoor conditions (see Figure 1). Particularly, after 10 meters of depth, the ground has a stable 9 °C temperature all year round.
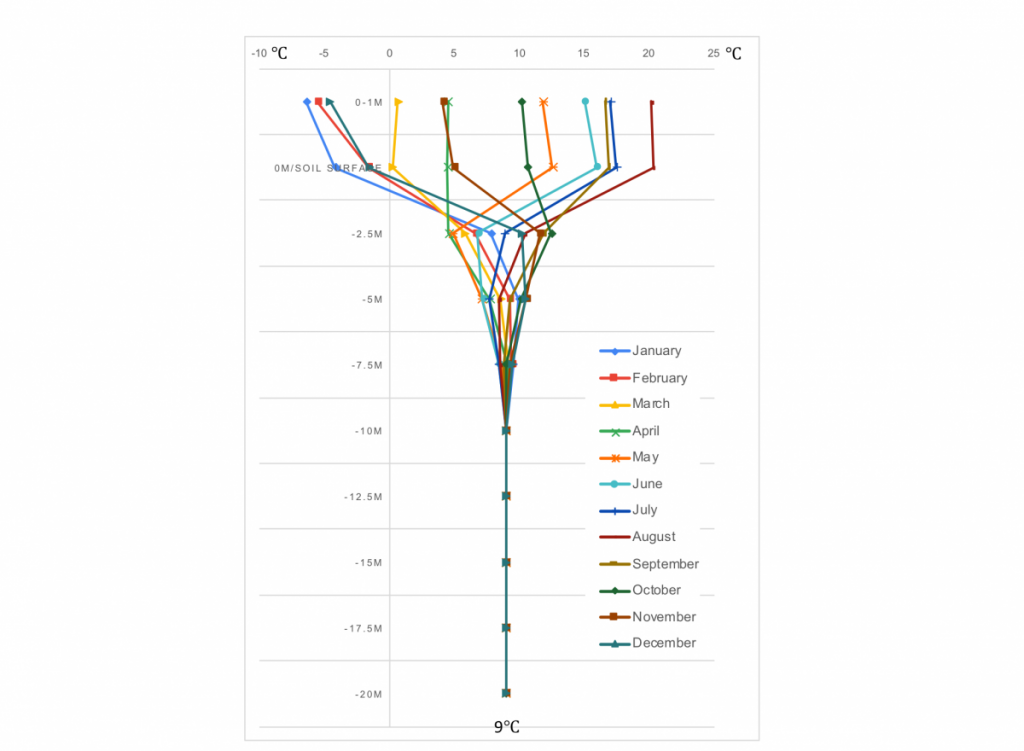
Figure 1. monthly average underground temperature
The impact of outdoor conditions was found majorly on the surface of the soil and gradually fades until 10 meters. The earlier boring survey showed us that the soil substructure until 3.30 meters was silty-sand (which has poor thermal conductivity) and contained very little amount of water. This finding could explain the large temperature changes observed between the subsurface’s 0- 2.5m depth. However, with the increased amount of water from 7.6m and below and changed soil density, thermal conductivity properties have improved and provided a more stable temperature underneath Memu (1).
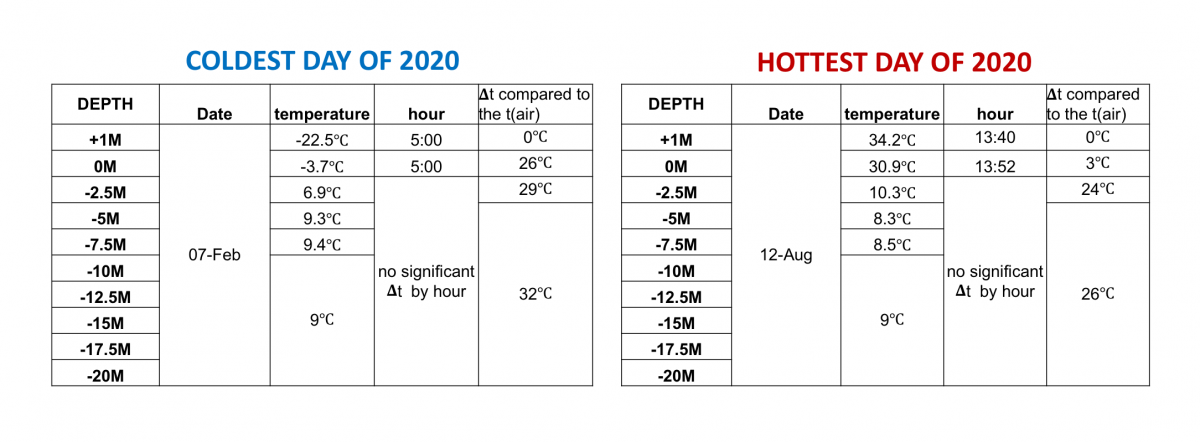
During the coldest day of the year (see Table 1), while the outdoor temperature was -22.5°C, at 5:00 am in the morning, under the ground at Memu was between 6.9°C to 9°C, which was about 32°C warmer than outdoors. On the other side, during the hottest day of the year with a 34.2°C temperature outside, the underground was only between 9°C to 10.3°C, which was about 26°C cooler than the outdoor temperature (see Table 1).
Table 1. coldest and the hottest underground temperature readings in 2020; (𝚫t: temperature difference, t(air): air temperature)
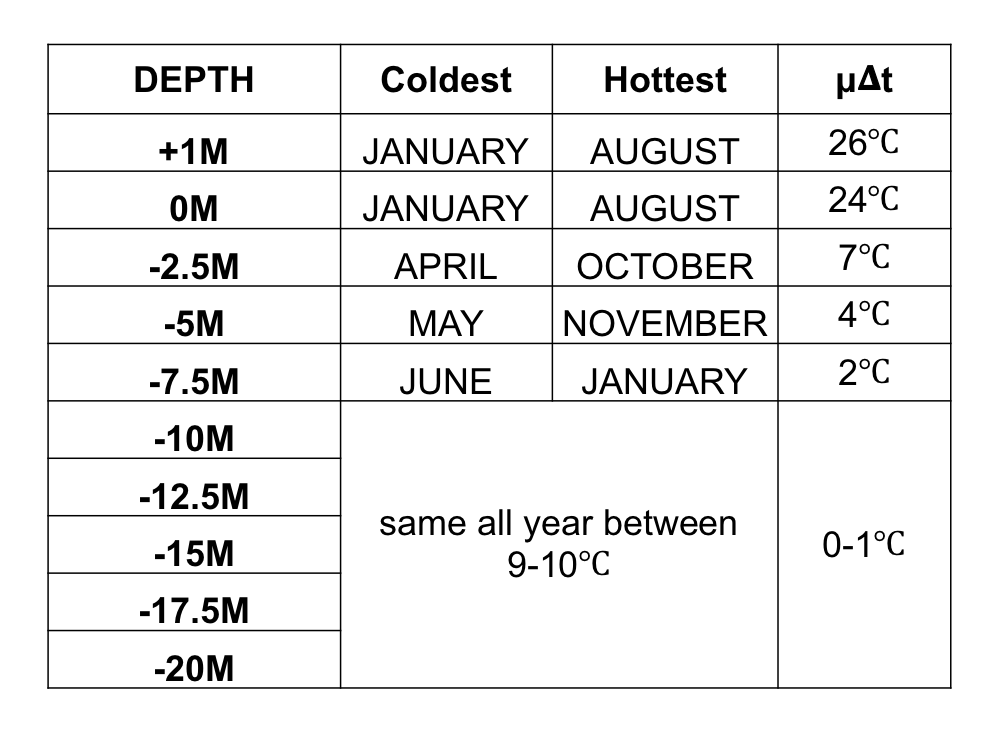
Another fact analyzed from the readings is that the outdoor temperature was reflected upon underground with a 1 to 3 months delay in time (see Figure 2 and Table 2). For example, the coldest time of the year in the air was January 2020. However, exactly this time of the year showed the warmest temperature at -7.5m under Memu. The average temperature difference (μ𝚫t) between the coldest month and the hottest month of 2020 was 26℃ in air, whilst this difference was as little as 7℃ at -2.5m and only 0-1℃ after -10m.
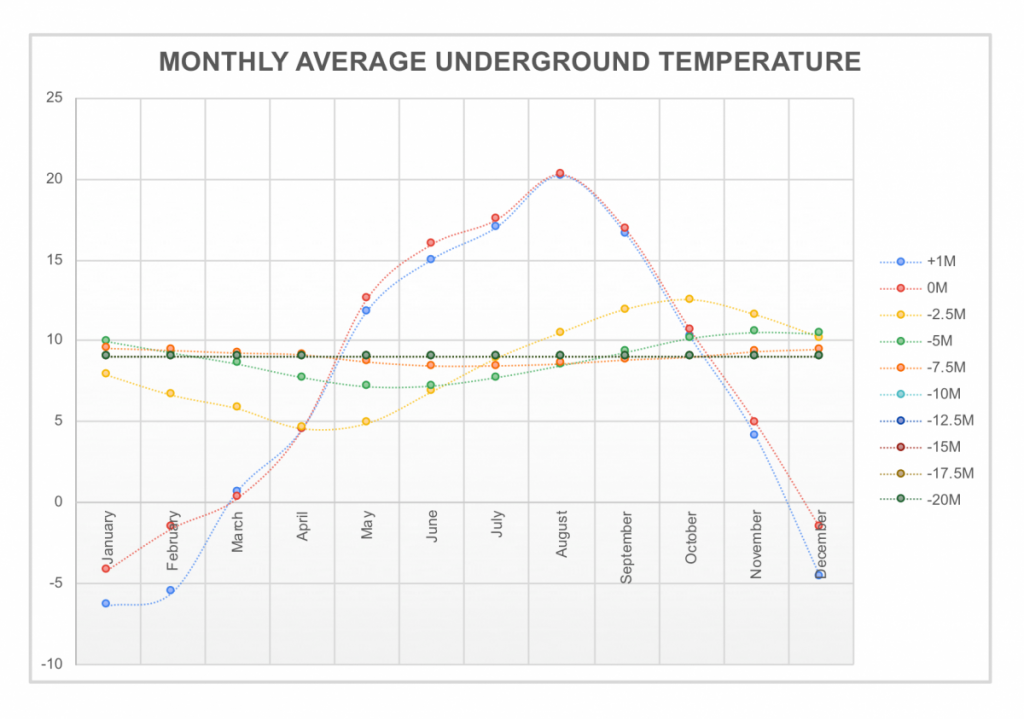
Figure 2. monthly average underground temperature in 2020
Table 2. coldest and the hottest underground temperature readings in 2020 by the depth
Our literature review and expert interviews about the geological properties of the South-Tokachi region showed us that the underground temperature rises about 1.5℃ at every 100 meters below the earth’s surface (2). Therefore, based on this given range of temperature rise, one could expect 10.5℃ to 11.5℃ of heat about 100m below Memu.
Details about the shallow subsurface’s geological and thermal conductivity properties at Memu are discussed under #shallow subsurface – geology.
potentials driven by the underground temperature
In summary, reading the underground temperature at Memu has surprised us by being vastly different than the air temperature for the given same time of the year. Particularly, underground offering a cool ambient during hot summer days and offering warm ambient during the coldest time of the year makes us see it as a favorable space for varied activities and a good source of energy.
Given that the rural conditions of the location ( infrastructural limitations, such as electricity distribution of the grid and heating demand during winter) by the explored potential lying in underground temperature could create self-sustaining solutions to overcome the limitations.
footnotes
1. Geothermal resources and underground heat have provided comfortable habitats for living and storing food for centuries (3). There are written records of geothermal usage in China which are over two thousand years old (4). Shallow ground geothermal heat has been effectively used on the household level for heating, hot water provision, and cooling (5, 6). Previous research showed that under the same climatic condition, the geothermal energy (Ground Sourced Heat Pump) system could save energy by 26–60% when working in heating mode, and 19–55% of energy could be saved when the system was working in cooling mode (7). Another benefit of utilizing underground heat is that it is independent of weather conditions and outdoor climate. Under the surface soil, the earth has a stable and comfortable temperature (8). Overall, the possibilities of effective use of geothermal heat are specific to the location. Currently, geothermal power has been left behind wind and solar in both growth and installed capacity. The main reasons may be a high initial investment, long payback time and construction time, difficulty to assess resources, and difficulty to modularize. Nevertheless, geothermal power has the potential to grow exponentially in the future (9).
references
(1) Márquez, J.M.A., Martínez Bohórquez, M.A. and Gómez Melgar, S., Ground Thermal Diffusivity Calculation by Direct Soil Temperature Measurement. Application to very Low Enthalpy Geothermal Energy Systems, Sensors 2016, 16, 306; doi:10.3390/s16030306
(2) Hiroshi Wakahma, Fujio Akita and Takeo Matsunami, Explanatory Text of the Geothermal Gradient Map of Hokkaido, Geological Survey of Hokkaido, 1995
(3) Alkaff, Saqaff A., Sim. S.C., Efzan, M.N., A review of underground building towards thermal energy efficiency and sustainable development, Renewable and Sustainable Energy Reviews, Volume 60, July 2016, Pages 692-713
(4) Fridleifsson Ingvar B., Geothermal energy for the benefit of the people, Renewable and Sustainable Energy Reviews, Volume 5, Issue 3, September 2001, Pages 299-312
(5) Dingfeng Caoa, and et.al., Investigation of the influence of soil moisture on thermal response tests using active distributed temperature sensing (A–DTS) technology, Energy & Buildings 173 (2018) 239-251
(6) Grab, T., Storch T., Gross, U., Performance of a geothermal heat pipe using propane, ASME 2011 International Mechanical Engineering Congress & Exposition, ColoradoU.S.A. Nov.11-17 (2011)
(7) Urchueguia J.F., Zacares M., Corberan J.M., Montero A., Martos J., Witte H., Comparison between the energy performance of a ground-coupled water to water heat pump system and an air to water heat pump system for heating and cooling in typical conditions of the European Mediterranean coast, Energy Conversation Management, 49 (2008), pp. 2917-2923
(8) Florides G., Kalogirou S., Ground heat exchangers—A review of systems, models and applications, Renewable Energy 32 (2007) 2461–247
(9) Keween Li., Bian, H., Liu C., Zhang D., Yanga Y., Comparison of geothermal with solar and wind power generation systems, Renewable and Sustainable Energy Reviews, Volume 42, February 2015, Pages 1464-1474
]]>“shallow subsurface – water”
text: Hande Unlu
The University of Tokyo, Institute of Industrial Science
published on April 26th, 2021
–
dynamism of water
The nature lying underneath the earth often doesn’t sound loud to us to turn our eyes and listen. Yet, the moment we lift its blanket and read deeper inside, we see how dynamic, diverse and harmonious at the same time.
Nature never remains still. What we read above the ground is under constant change. It changes its form, often flows, and penetrates the earth. During our survey, we were thrilled to record this very circle of nature: the water.
Like how water brings life under the earth, underground water can also significantly contribute to creating social and economic benefits to its local area¹. Therefore, for an accurate understanding of the underground potentials at Memu, we realized a shallow subsurface survey and analyzed the dynamism of the water.
the readings from the survey
In November 2019 we realized a shallow subsurface survey by digging a 20 meters borehole in the ground. The data collected through this survey provided us the information to analyze the soil structure, underground temperature, and the dynamism of the water level around the year.
During the soil survey on 22 November 2019, we found the water at the level of 7.60m below the ground. The readings later showed us that the water elevation at this date was 7.35m. Details about the survey and its findings are discussed at #shallow subsurface – geology.
Following the soil substructure and temperature surveys, in September 2020, we installed a water-level-transmitter type of sensor at 15 meters under the ground inside the borehole. The underground water level was recorded hourly between September 2020 until April 2021 (ongoing) to analyze the impact of the outdoor winter.
The winter recordings have shown us how dynamic the water was right below us while the outdoors were in a deep sleep under the white elegant blanket of nature; the snow of Hokkaido. Figure 1 illustrates the monthly average underground water level recorded during the mentioned period of the year.

Figure1. monthly average underground water level (meter)
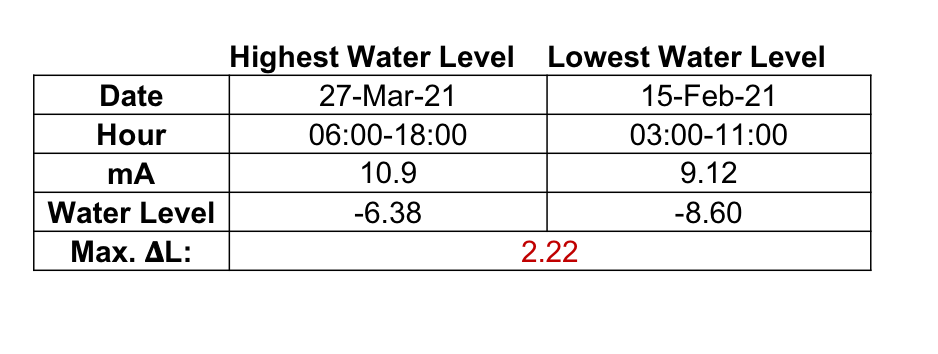
Table 1 shows that the highest water level was observed on the 27th of March 2021, whilst the lowest level was recorded just a month earlier, on the 15th of February 2021. During this period, the difference between the water levels (Max. 𝚫L) was 2.22 meters, which is the maximum recorded level change between September 2020 – April 2021.
Table 1. comparison of the highest and the lowest water level
Moreover, according to the readings during the winter season, the average water level was 7.78m below the ground. Again, during the same period, the average depth of the water was about 7.22m.
Later, we overlapped the underground water level data with the outdoor and underground temperature data illustrated in Figure 2. Analyzing the overlapped data sets, we found a sudden rise in the water level between February and March when the air temperature had risen from -5℃ to +2℃ (recorded monthly average temperature). In March 2021, the average air temperature reached above 0℃ for the first time since it dropped below 0℃ in November 2020. This recovery from subzero air temperature could be interpreted as the cause of the melting snow and ice. Consequently, the melted snow and ice resulted in rising the water level below the ground at Memu.
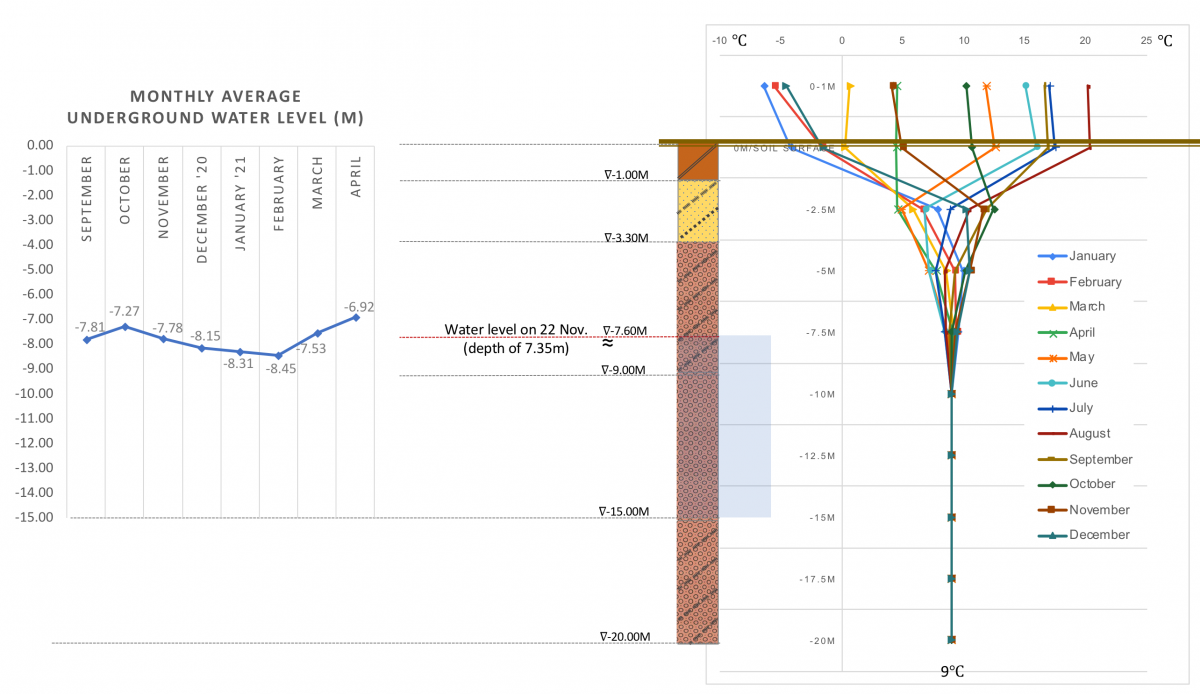
Figure 2. underground water level and temperature by months
Later, April 2020 was found to be the coldest time of the year at -2.5m which could be the time that the melting ice and snow penetrated the subsurface and reached this level. Following the underground water flow, the coldest underground temperature at -5m and -7.5m was recorded respectively in May and June.
future for the underground water @ memu
Our survey showed us that the impacts of the winter season at Memu were in the form of melted water, penetrating the shallow subsurface along the spring season. The rise of underground water caused by the melting ice and snow started in the middle of February and peaked by the end of March. The underground water flow certainly is not the only factor cooling the subsurface temperature, but one of the most effective causes due to its high thermal conductivity (1).
Briefly, starting from the end of February throughout the spring season, one can expect an abundance of water resources under the ground of Memu. This underground water resource could be used for natural heating, cooling, and ventilation either for above the ground purposes or for purposes built down below the ground (2-4).
….and this is where our readings hope to give a sparkle to creative ideas.
* the further readings from the shallow subsurface survey series can be found under #shallow subsurface – geology and #shallow subsurface – temperature.
footnotes
1. Groundwater is vital to many nations, irrespective of their stage of economic development. Over the past few decades, accelerated groundwater development has resulted in great social and economic benefits by providing low-cost, drought-reliable, and (mainly) high-quality water supplies for urban areas, for the rural population, and for irrigation of (potentially high-value) crops. (5)
references
(1) Li B., Han Z., Hu H., Bai C., Study on the effect of groundwater flow on the identification of thermal properties of soils, Renewable Energy, Volume 147, Part 2, March 2020, Pages 2688-2695
(2) Meir, I. A., Gilead I., Underground dwellings and their microclimate under arid conditions, Design With the Environment, Proc. 19th PLEA 2002 Int. Conf. Toulouse, France, Vol.2, pp. 618-624.
(3) Unver, B., Agan, C., Application of heat transfer analysis for frozen food storage caverns, Tunnelling and Underground Space Technology 18(2003)7–17
(4)Fujio Tsuchiya, Development of Large Storage Facility for Practical Use under Low Temperature using Heat Pipes in Yachiyo Region in Obihiro, Hokkaido, journal of natural energy research Hokkaido, no.6, 15-22, 2009
(5) Kemper, E.K., Groundwater—from development to management, Hydrogeology Journal (2004) 12:3–5
(6)大樹地域の地質、地質調査所、昭和49年 (Geology of Taiki Region, Regional Geological Research Report, 1973), Geological Survey of Japan online archives https://www.gsj.jp/data/50KGM/PDF/GSJ_MAP_G050_02064_1974_D.pdf
(7)営農用深層地下水調査 南十勝地区, 北海道開発局,昭和46年 (Groundwater Survey for Farming, South Tokachi Region, issued by Hokkaido Regional Development Bureau of Agriculture and Fisheries Department, 1971), Hokkaido Research Organization Archives
(8) 十勝南部地域の地形と地質,北海道立地下資源調査所,平成2年 (Topography and Geology of South Tokachi Region,1990, Hokkaido Research Organization
]]>
date: september 2019
location: toberi marsh estuary
title: estuary of toberi
film: yu morishita
to-pus-i drainage basin & vegetation
map works: Takaharu Igarashi
]]>Grounding Research
date: September 9th, 2019
location: 42.414727,143.388254
location: monbetsu river/mo-pet, taiki, jp
filming: Yu Morishita ]]>
location: estuary of rekifune river / pe-rupne-i
date: september 9th, 2019
film: yu morishita
date: october 20th, 2019
film: yu morishita
]]>Grounding Research
date: march 3rd, 2019
location: 42.445554, 143.411232
location: estuary of rekifune river / pe-rupne-i
filming: Sam King Film
recording: James Greer
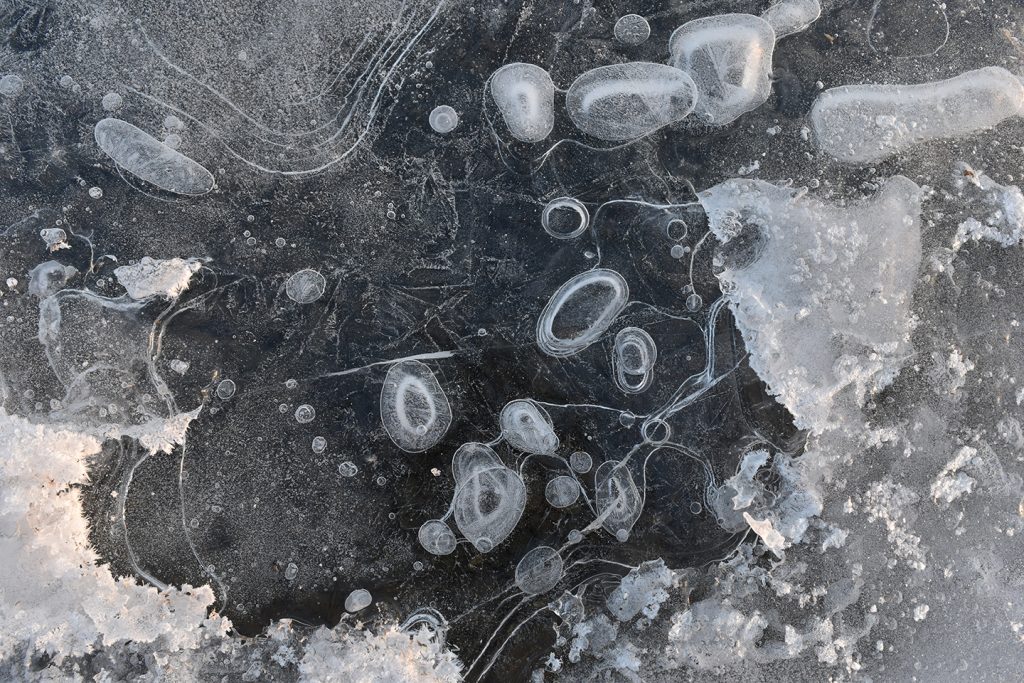
photos: Yu Morishita
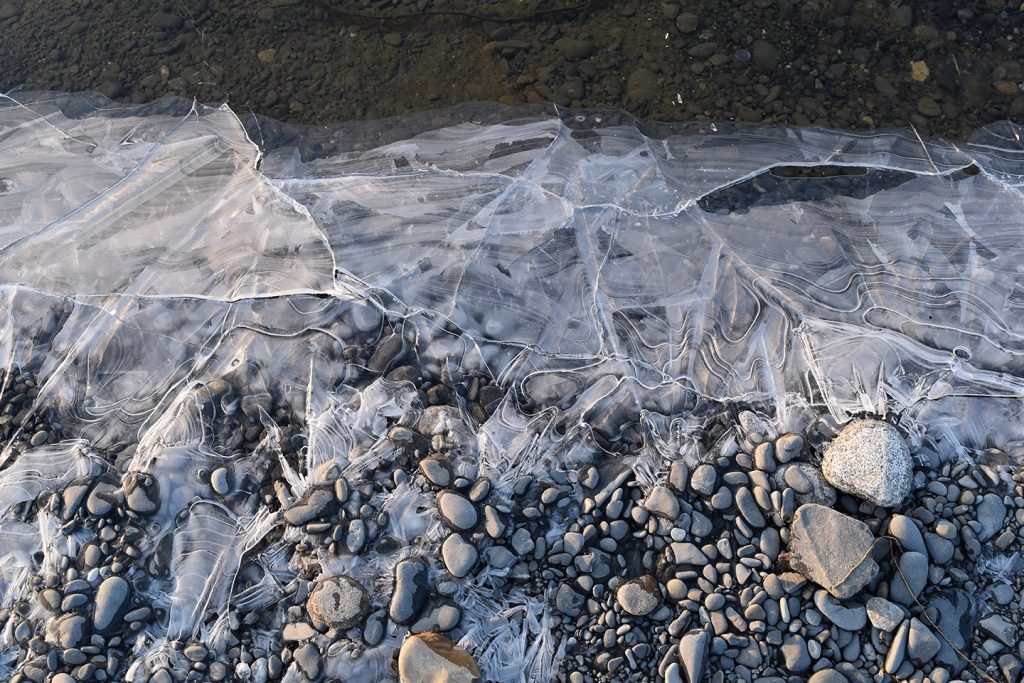
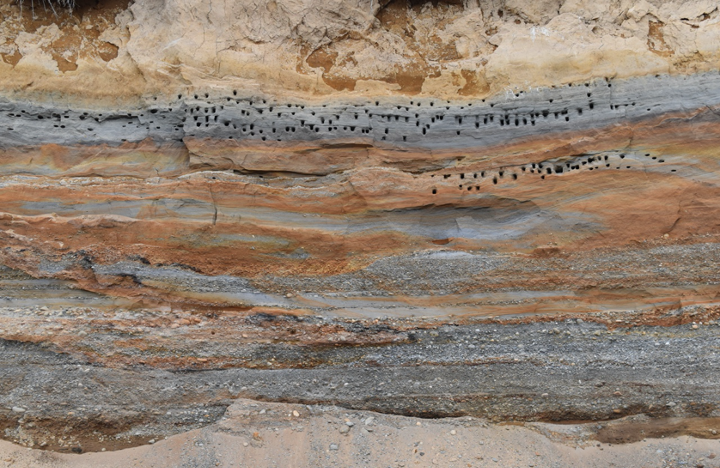
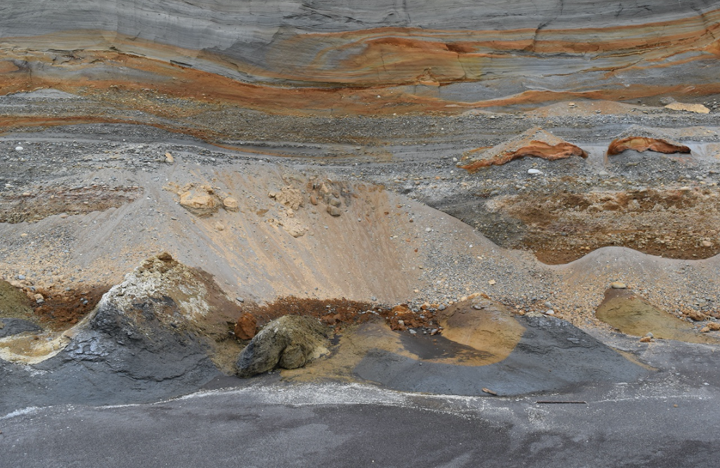
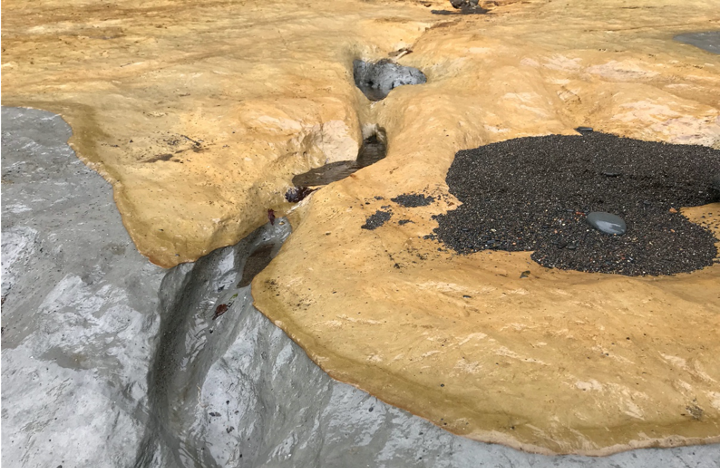
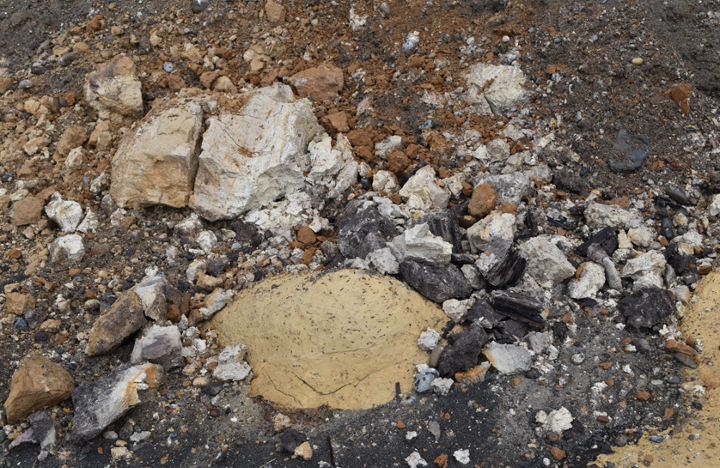
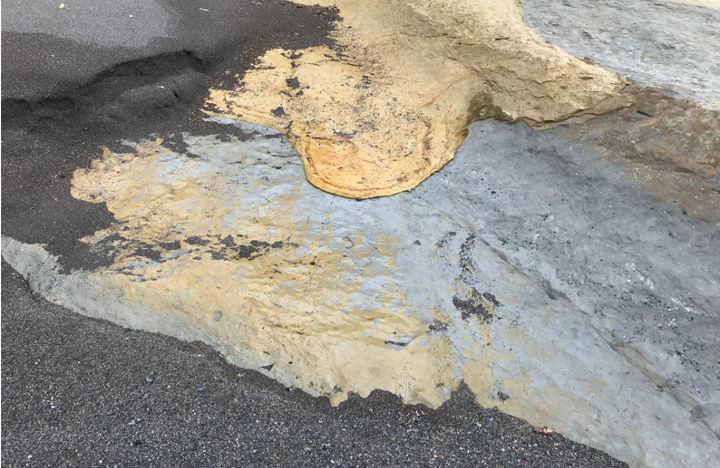
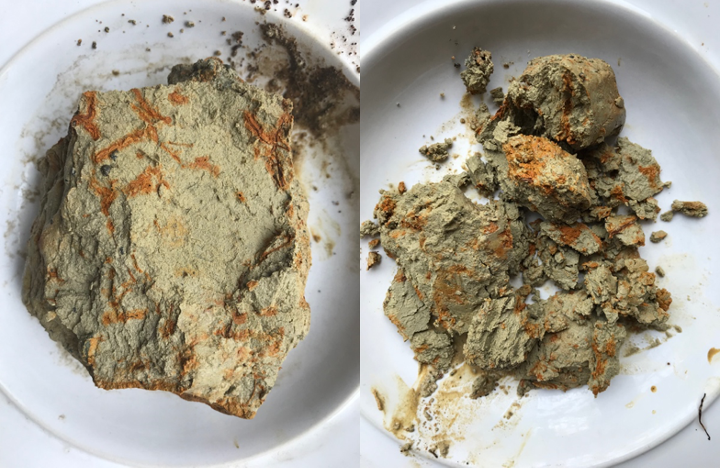
]]>location: tobetsu/to-pus-i estuary strata, taiki jp
date: july 27th, 2019
recording: James Greer
date: july 27th, 2019
photograph: Yu Morishita
date: october 25th, 2019
film: Yu Morishita
]]>Grounding Research
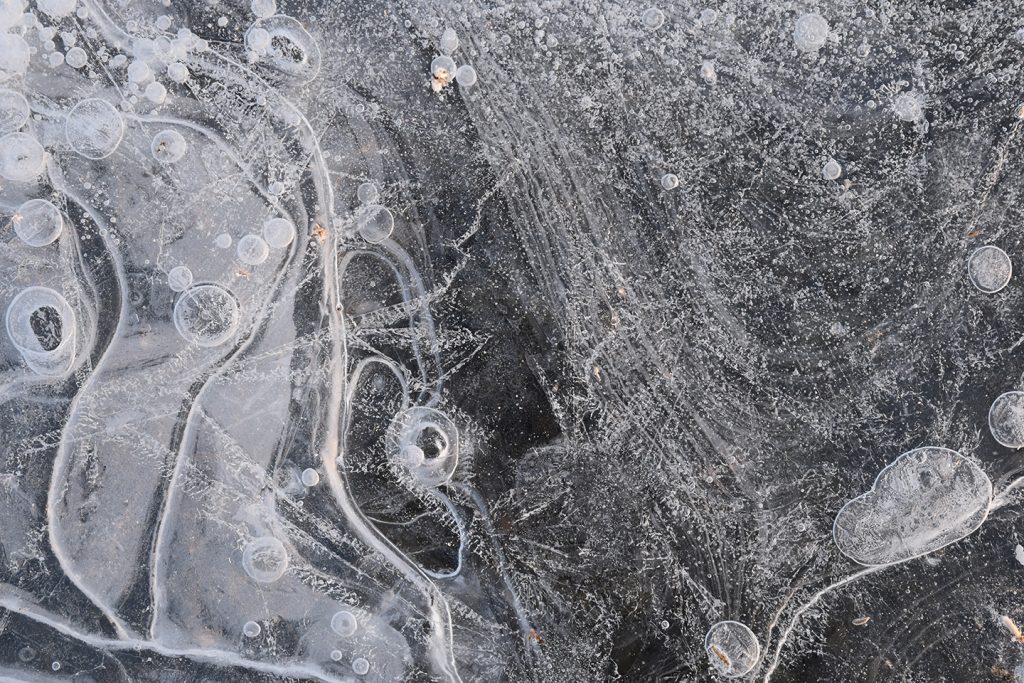
date: march 4th 2019
location: 42.524482, 143.193754
location: rekifunegawa, in front of kamuikotan camp park, taiki jp
film: Sam King
recording: James Greer
]]>