research in progress
“shallow subsurface – water”
text: Hande Unlu
The University of Tokyo, Institute of Industrial Science
published on April 26th, 2021
–
dynamism of water
The nature lying underneath the earth often doesn’t sound loud to us to turn our eyes and listen. Yet, the moment we lift its blanket and read deeper inside, we see how dynamic, diverse and harmonious at the same time.
Nature never remains still. What we read above the ground is under constant change. It changes its form, often flows, and penetrates the earth. During our survey, we were thrilled to record this very circle of nature: the water.
Like how water brings life under the earth, underground water can also significantly contribute to creating social and economic benefits to its local area¹. Therefore, for an accurate understanding of the underground potentials at Memu, we realized a shallow subsurface survey and analyzed the dynamism of the water.
the readings from the survey
In November 2019 we realized a shallow subsurface survey by digging a 20 meters borehole in the ground. The data collected through this survey provided us the information to analyze the soil structure, underground temperature, and the dynamism of the water level around the year.
During the soil survey on 22 November 2019, we found the water at the level of 7.60m below the ground. The readings later showed us that the water elevation at this date was 7.35m. Details about the survey and its findings are discussed at #shallow subsurface – geology.
Following the soil substructure and temperature surveys, in September 2020, we installed a water-level-transmitter type of sensor at 15 meters under the ground inside the borehole. The underground water level was recorded hourly between September 2020 until April 2021 (ongoing) to analyze the impact of the outdoor winter.
The winter recordings have shown us how dynamic the water was right below us while the outdoors were in a deep sleep under the white elegant blanket of nature; the snow of Hokkaido. Figure 1 illustrates the monthly average underground water level recorded during the mentioned period of the year.

Figure1. monthly average underground water level (meter)
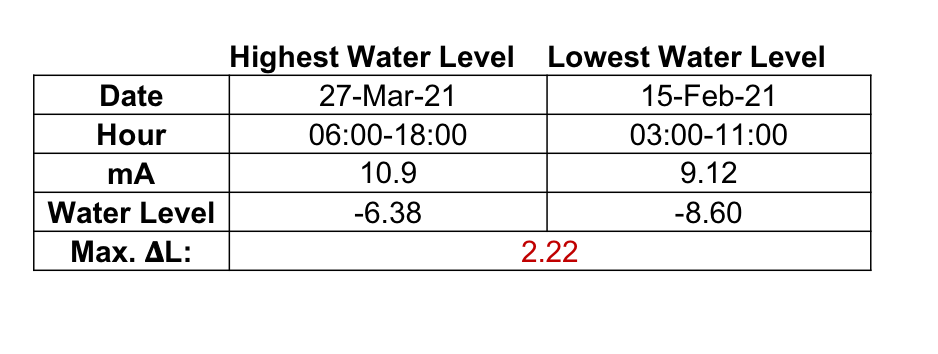
Table 1 shows that the highest water level was observed on the 27th of March 2021, whilst the lowest level was recorded just a month earlier, on the 15th of February 2021. During this period, the difference between the water levels (Max. 𝚫L) was 2.22 meters, which is the maximum recorded level change between September 2020 – April 2021.
Table 1. comparison of the highest and the lowest water level
Moreover, according to the readings during the winter season, the average water level was 7.78m below the ground. Again, during the same period, the average depth of the water was about 7.22m.
Later, we overlapped the underground water level data with the outdoor and underground temperature data illustrated in Figure 2. Analyzing the overlapped data sets, we found a sudden rise in the water level between February and March when the air temperature had risen from -5℃ to +2℃ (recorded monthly average temperature). In March 2021, the average air temperature reached above 0℃ for the first time since it dropped below 0℃ in November 2020. This recovery from subzero air temperature could be interpreted as the cause of the melting snow and ice. Consequently, the melted snow and ice resulted in rising the water level below the ground at Memu.
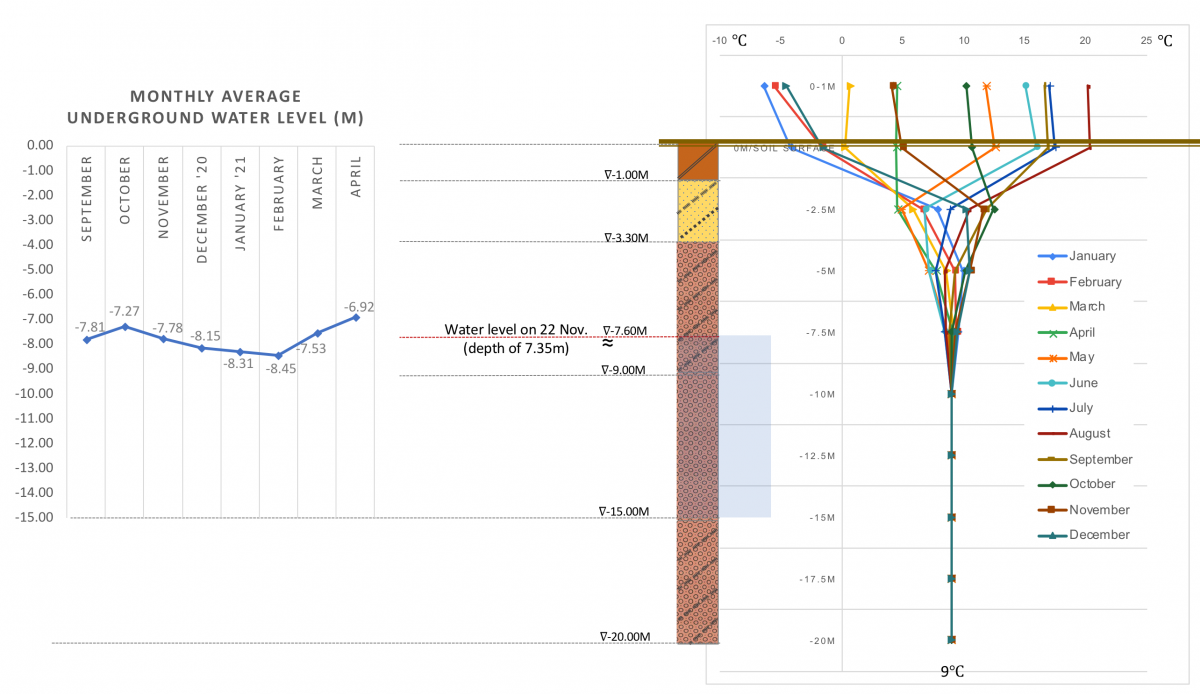
Figure 2. underground water level and temperature by months
Later, April 2020 was found to be the coldest time of the year at -2.5m which could be the time that the melting ice and snow penetrated the subsurface and reached this level. Following the underground water flow, the coldest underground temperature at -5m and -7.5m was recorded respectively in May and June.
future for the underground water @ memu
Our survey showed us that the impacts of the winter season at Memu were in the form of melted water, penetrating the shallow subsurface along the spring season. The rise of underground water caused by the melting ice and snow started in the middle of February and peaked by the end of March. The underground water flow certainly is not the only factor cooling the subsurface temperature, but one of the most effective causes due to its high thermal conductivity (1).
Briefly, starting from the end of February throughout the spring season, one can expect an abundance of water resources under the ground of Memu. This underground water resource could be used for natural heating, cooling, and ventilation either for above the ground purposes or for purposes built down below the ground (2-4).
….and this is where our readings hope to give a sparkle to creative ideas.
* the further readings from the shallow subsurface survey series can be found under #shallow subsurface – geology and #shallow subsurface – temperature.
footnotes
1. Groundwater is vital to many nations, irrespective of their stage of economic development. Over the past few decades, accelerated groundwater development has resulted in great social and economic benefits by providing low-cost, drought-reliable, and (mainly) high-quality water supplies for urban areas, for the rural population, and for irrigation of (potentially high-value) crops. (5)
references
(1) Li B., Han Z., Hu H., Bai C., Study on the effect of groundwater flow on the identification of thermal properties of soils, Renewable Energy, Volume 147, Part 2, March 2020, Pages 2688-2695
(2) Meir, I. A., Gilead I., Underground dwellings and their microclimate under arid conditions, Design With the Environment, Proc. 19th PLEA 2002 Int. Conf. Toulouse, France, Vol.2, pp. 618-624.
(3) Unver, B., Agan, C., Application of heat transfer analysis for frozen food storage caverns, Tunnelling and Underground Space Technology 18(2003)7–17
(4)Fujio Tsuchiya, Development of Large Storage Facility for Practical Use under Low Temperature using Heat Pipes in Yachiyo Region in Obihiro, Hokkaido, journal of natural energy research Hokkaido, no.6, 15-22, 2009
(5) Kemper, E.K., Groundwater—from development to management, Hydrogeology Journal (2004) 12:3–5
(6)大樹地域の地質、地質調査所、昭和49年 (Geology of Taiki Region, Regional Geological Research Report, 1973), Geological Survey of Japan online archives https://www.gsj.jp/data/50KGM/PDF/GSJ_MAP_G050_02064_1974_D.pdf
(7)営農用深層地下水調査 南十勝地区, 北海道開発局,昭和46年 (Groundwater Survey for Farming, South Tokachi Region, issued by Hokkaido Regional Development Bureau of Agriculture and Fisheries Department, 1971), Hokkaido Research Organization Archives
(8) 十勝南部地域の地形と地質,北海道立地下資源調査所,平成2年 (Topography and Geology of South Tokachi Region,1990, Hokkaido Research Organization